lunes, 29 de abril de 2019

jueves, 25 de abril de 2019
Book Week
 Hi kids! We remind you this is a special week. We are celebrating READING with many activities for you to participate:
- Yesterday we had the readathon which was a success.
- Come dressed up as your favorite character this Friday.
- Enjoy reading during break time in the main hall (the house like place).

lunes, 22 de abril de 2019
To infinity and beyond!
Transdiciplinary theme:

CENTRAL IDEA:
Energy moves and produces changes in the universe.
LINES OF INQUIRY:
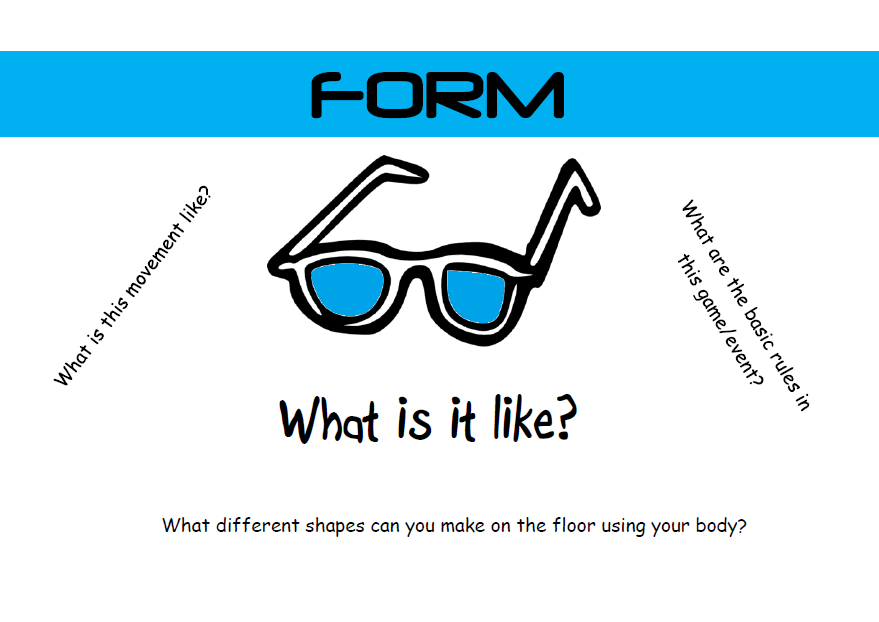
Different types of energy (FORM)
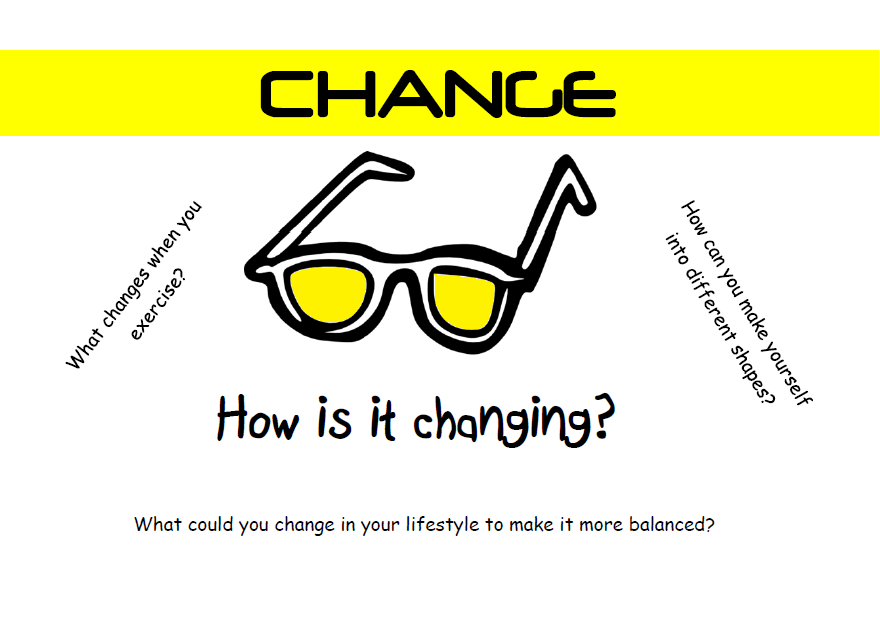
Energy is in constant transformation (CHANGE)
Elements in space move and have an effect on Earth.(CAUSATION)
Different types of energy (FORM)
Energy is in constant transformation (CHANGE)
Elements in space move and have an effect on Earth.(CAUSATION)

Everyday is Earth day!

By doing little things we can help the world to become a better place for our generation and the following ones. Go and tell your family and friends, start taking action today.
martes, 16 de abril de 2019
martes, 9 de abril de 2019
How to use READWORKS?
Hi everyone! In this post we are going to share with you the steps you need to follow to work at home with the website READWORKS.
First of all, you need to click on the logo shown bellow in order to enter the website.

Here we go!


jueves, 4 de abril de 2019
Pictographs
Pictographs
A pictograph is a way to represent data using images. They can also be called picture graphs or pictograms.
Pictographs represent the frequency of data while using symbols or images that are relevant to the data.
How to make a Pictograph?
Let's see an example. We will represent students' favorite subjects using a pictograph. So let's start!
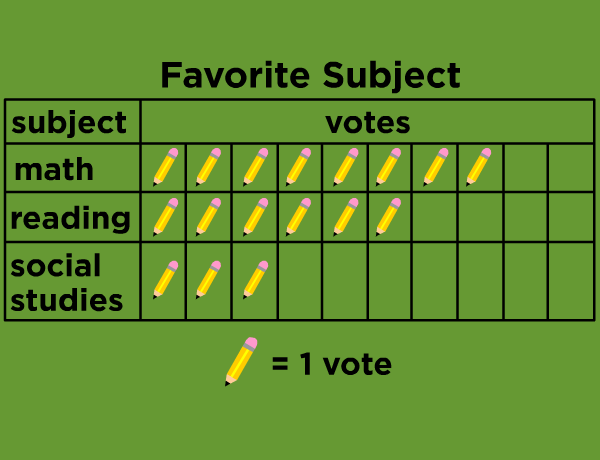
- Collect Data: The first step is to collect data for the categories you want to represent.Then make a list or table about the data.
- Pick your symbol: Pick a symbol or picture to represent your data. If you are drawing a pictograph to represent students' favorite subjects at school, a symbol of a basketball ball would be confusing! Pick your symbol carefully.
- Assign a Key: Sometimes the frequency of the data is repeated several times. Then one symbol cannot represent one frequency. You must set a numerical value that one symbol will represent. This numerical value must be written along with the pictograph. In the example above the symbol of a pencil represents one student voting for a specific subject. This is the pictograph's key.
- Draw the pictograph: The final step is drawing your pictograph. Draw the two columns that represent the category and the data. Then draw the actual symbols that represent the frequencies.
- Review your Data: Finally, review your pictograph and make sure it correctly represents the information that you wanted to show. Don’t forget to check the labelling of your graph.
Why don't you try solving the following questions (using a piece of paper) based on the pictograph about children's favorite sports? Good luck!

Suscribirse a:
Entradas (Atom)
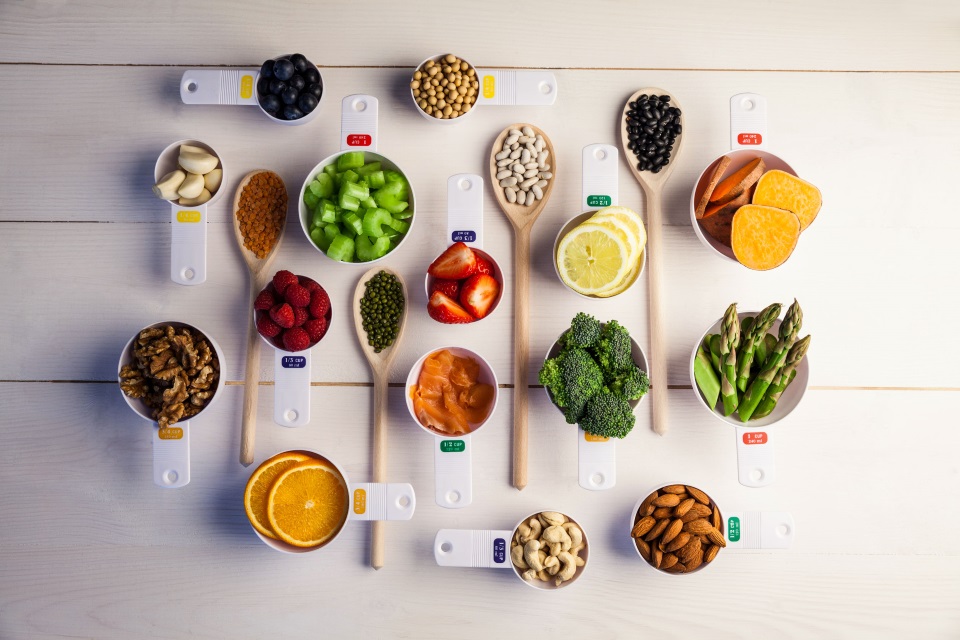
Macronutrients and Micronutrients
What can we find in the food we eat? Take a look at the following webpages to find out more. Macronutrients: proteins, carbs, fats. ...
-
The development of civilization is affected by geography. Rome did not spring into being as a power on the Italian peninsula. It began as...
-
Speech bubbles and their meaning. Speech bubbles are used as text holders and there are a variety of them. The context in whic...
-
What can we find in the food we eat? Take a look at the following webpages to find out more. Macronutrients: proteins, carbs, fats. ...


