Pictographs
A pictograph is a way to represent data using images. They can also be called picture graphs or pictograms.
Pictographs represent the frequency of data while using symbols or images that are relevant to the data.
How to make a Pictograph?
Let's see an example. We will represent students' favorite subjects using a pictograph. So let's start!
- Collect Data: The first step is to collect data for the categories you want to represent.Then make a list or table about the data.
- Pick your symbol: Pick a symbol or picture to represent your data. If you are drawing a pictograph to represent students' favorite subjects at school, a symbol of a basketball ball would be confusing! Pick your symbol carefully.
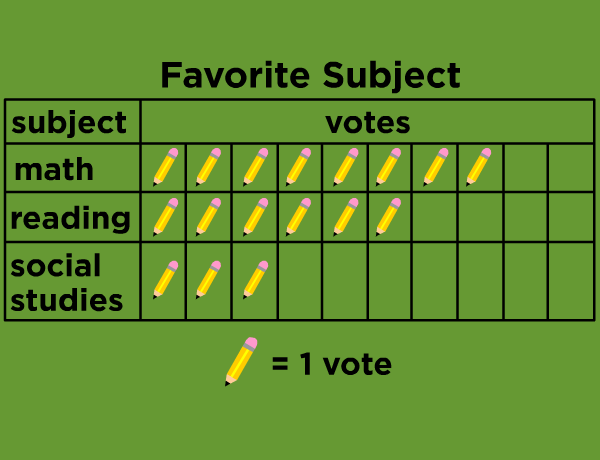
- Assign a Key: Sometimes the frequency of the data is repeated several times. Then one symbol cannot represent one frequency. You must set a numerical value that one symbol will represent. This numerical value must be written along with the pictograph. In the example above the symbol of a pencil represents one student voting for a specific subject. This is the pictograph's key.
- Draw the pictograph: The final step is drawing your pictograph. Draw the two columns that represent the category and the data. Then draw the actual symbols that represent the frequencies.
- Review your Data: Finally, review your pictograph and make sure it correctly represents the information that you wanted to show. Don’t forget to check the labelling of your graph.
Why don't you try solving the following questions (using a piece of paper) based on the pictograph about children's favorite sports? Good luck!


No hay comentarios:
Publicar un comentario